

In order to analyze geographical layouts of the globe, map projections are necessary tools that are used to convert the spherical composition of a globe to a flat “projection” surface. Essentially, a map projection is the conversion of a three-dimensional global representation into a two-dimensional form through mathematical transformation. For this assignment, I analyzed three different types of map projections: conformal, equidistant, and equal-area. The conformal map projections preserve the right angles formed by lines of latitude with meridians, equidistant map projections have distances that are uniform from the center to any other place on the map, and equal-area maps preserve the same proportional relationship of countries. However, map projections are problematic tools when trying to obtain an accurate representation of the Earth. The problem with the conversion is that it distorts the location and size and various features on the three-dimensional surface when it converts it into a two-dimensional plane, cylinder, or cone. For example, the conformal Mercator map projection shows a Greenland that is approximately the same size as North America and an Antarctica that is larger than all other existing continental landmasses. While the Mercator map projection does successfully preserve the shape and the direction of the original landmasses from the three-dimensional globe, the aforementioned distorted areas are quite easy to recognize. The 30° x 30° graticule also further accentuates the disproportionate sizes of the polar countries and continents.
Distortion depends not only on the map projection but also on the shape the two-dimensional map projection takes. For example, the aforementioned Mercator map projection takes on a rectangular shape, thus distorting the continental masses found in the Polar Regions. This happens because the top half of the three-dimensional globe, which typically tapers inward, is pressed flat to create the two-dimensional map projection. In contrast, the Stereographic map projection, another conformal projection, has a circular composition that results in the disproportional enlargement of Australia. Based on this example, it is important to remember that when working with map projections, distortion will vary based on the ultimate shape of the final two-dimensional projection.
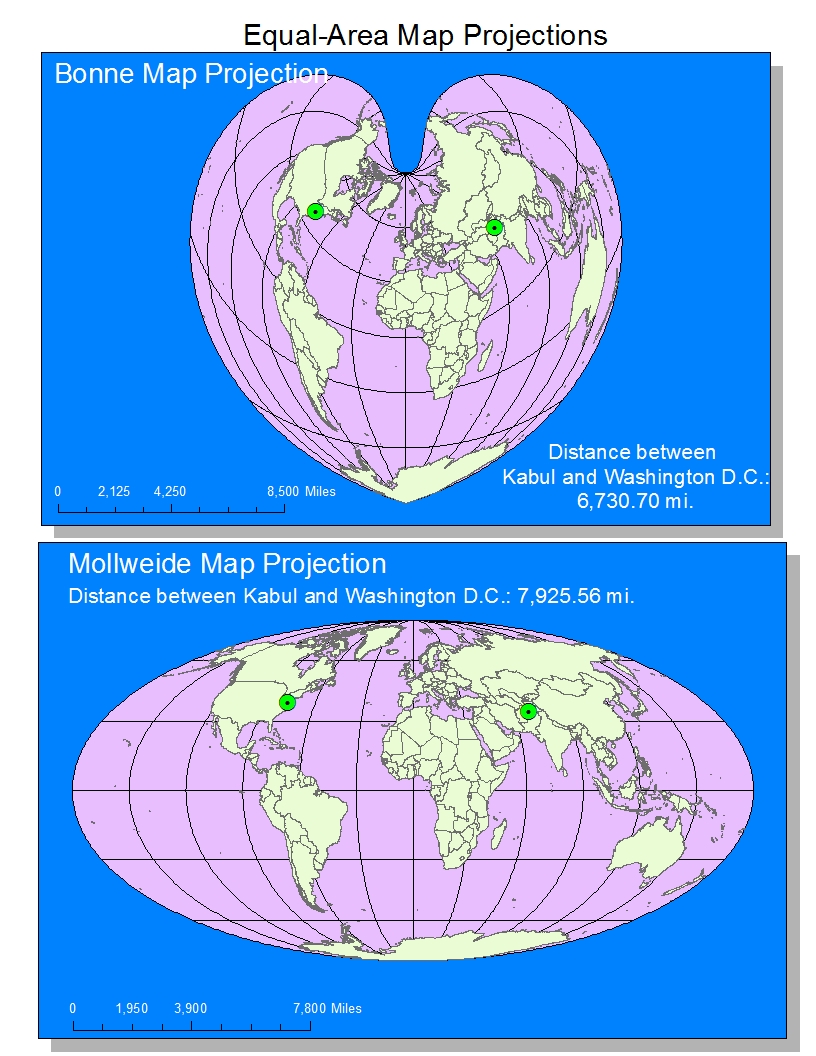
The accuracy of map projections also is largely dependent on the purpose for which they are being used. For example, in a simple sense, a map projection can be used just to gain a better understand of the relative location of the Earth’s continental mass in relation to the rest of its mass. For example, map projections like the equal-area Mollweide and the equidistant Plate Carree map projections do a solid job (relatively speaking) in showing the general geographical layout of the Earth because they maintain a 30° x 30° graticule that lines up appropriately with the continents as it does on the globe. However, projections like the equal-area Bonne map projection (which is a three-dimensional shape that resembles a heart), the Stereographic map projection, and the Azimuthal Equidistant map projection all skew the latitude and longitude lines of the 30° x 30° graticule, making relative location and coordinate position both increasingly difficult to interpret. While the Mercator projection has a well-defined 30° x 30° graticule, the massive distortion of the Polar Regions decreases the accuracy of the relative location interpretation in higher latitudes. In order to figure out a specific location, surveying would likely be a more accurate tool than map projections, and it’s important to have a higher, if not complete, degree of accuracy when looking at a specific region, especially if it’s to do something like a construction projection where specific location must be certain.
By measuring the distance between two cities, one can determine how map projections alter the relative distance between two points. The Bonne map projection is understandably the projection that exhibited that closest distance between Washington, D.C. and Kabul (only 6,730.7 mi), given that the projection pinches the Earth back on itself, shortening the distance between objects on the other side. The flat, rectangular projections exhibit the farthest distance between Washington, D.C. and Kabul. For example, the Mercator map projection measured a distance of 10,112.12 mi. and the Plate Carree map projection measured a distance of 10,109.67 mi between the two cities. This increased distance is likely due to the stretching of the northern and southern hemispheres to line up at the 180° line of longitude. The Stereographic map projection (distance between Washington, D.C. and Kabul: 9,878.04 mi) and the Azimuthal Equidistant map projection (distance between Washington D.C. and Kabul: 8,341.41 mi) map projections both increase the distance between the two cities by rotating the North American and Asian continents away from each other in the distortion. The Mollweide map projection experiences the same distortion, except at a lesser extent with the distance between the two cities being only 7,925.56 mi. Because map projections all distort and alter different features based on the feature that they are trying to preserve, it is virtually impossible to get a complete accurate measurement of geographical relationships on the Earth’s surface from a map projection.
No comments:
Post a Comment